
Adventures in Data - An Update
Source: Photo by Sharefaith from Pexels, CC0
I wanted to give an update on my data journey. I spent a lot of time in the past three months continuing the Google Data Analytics Professional Certification course. I am now on Course 5 out of 8, with the 8th course being the capstone portfolio project. And the 7th course will be on the programming language R and RStudio, which I am excited for. I never had a good excuse to fully dive into R, since I knew how to do data science stuff in Python, but this work with R will help me be a well-rounded data person. I exerienced just how convenient R can be for data science when I saw the things the Shiny package can do. I have begun thinking about streaming my work with data on Twitch, but that will require a better microphone and better planning on how to structure my walkthroughs. I’ll give an update on this later!
I also had an interesting series of interviews with a major Pharma company. I have been looking at positions strictly in the public sphere, but I am also getting noticed by recruiters from private industry. While the interviews were much shorter than the grueling 8+ hour academic librarian interviews, I was assigned a challenging programming exercise to see how well I could code in Python. This particular exercise was focused on organizing, transforming, querying additional data sources via APIs, and finally generating data outputs in a delimited file.
I had a good overview of the exercise, but didn’t have access early on to the actual input file (encoded in the Turtle data format). Without the file, though, I could still start a git repo, and anticipate the kinds of Python packages I would need. I eventually pushed it to GitHub, and you can check it out there if you’d like to. For package management, I went with Anaconda, since I find it very easy to export and re-create environments with it. I was fortunate to find a package that links ideas from both the pandas and rdflib libraries, appropriately named rdfpandas. This helped me find an easy way to generate a DataFrame from the Turtle file.
Creating the first DataFrame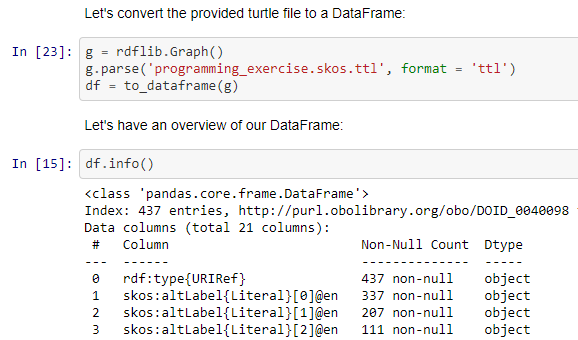
The next step was to query data from the file we need, using the query language SPARQL. You can think of SPARQL as the SQL of linked data. We only needed to pull the labels and IDs of the terms from the file, which was put into a new DataFrame.
Building the SPARQL query on the file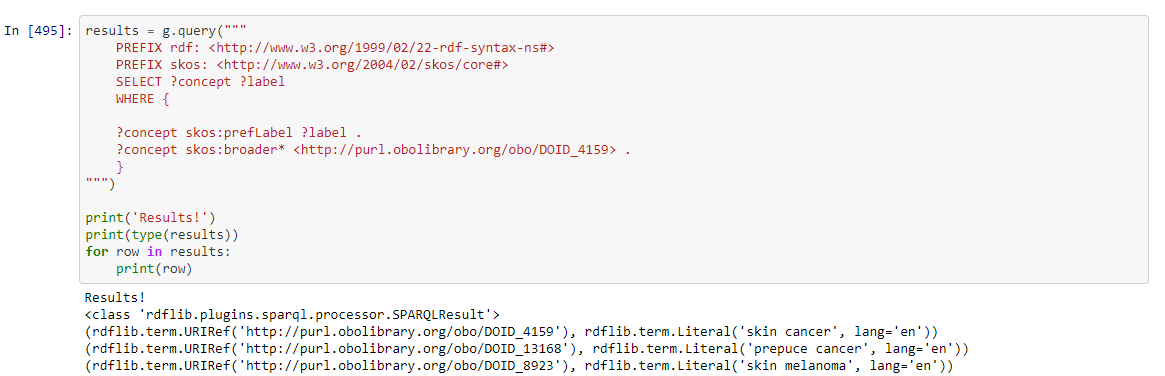
After some cleaning and formatting of the DataFrame, we were ready to use this data to query two biomedical data sources via their APIs. Lastly, we could take this final DataFrame and write it out to a delimited file, in this case a CSV. The API qurying took me the longest time, because as is the case with many APIs, their documentation can be confusing or missing vital information.
Making API calls to OLS (Ontology Lookup Service)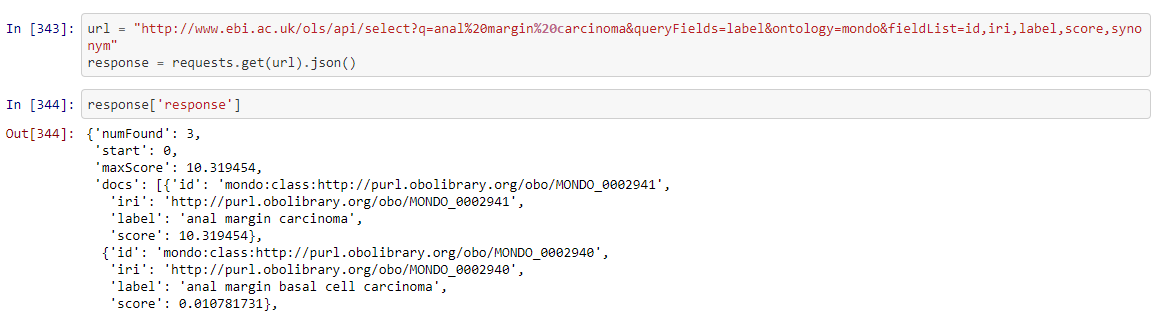
The only solution is to keep testing new queries and figuring out how to utilize the API parameters to get the data you want. In this case, I was aided a lot by working within a Jupyter notebook, which would have been much harder if I were working in a console.
Overall I think I did well in the exercise, but there are definitely things I would improve if I had the chance to work on it more. I would be a little more data science-y when it came to the results of the API call data. I could have factored in the “score” parameter more, and would come up with a confidence interval to evaluate just how well terms from the file matched the terms brought back from the API.
So that’s about all for now. Hopefully in my next update, I will have completed my Google Data Analyst Certification, and I will be gainfully employed! ![]()